Economy
With New GDP Series, India Will Finally Measure The Economy It Actually Has
Swarajya Staff
Feb 26, 2026, 10:32 AM | Updated 10:52 AM IST
For most of the past decade, India's statisticians have been in an awkward position. They were producing quarterly GDP estimates using a basket of prices last benchmarked in 2011-12, with deflators drawn from roughly 180 items, and corporate sector data drawn from company filings with the Ministry of Corporate Affairs — a database that economists repeatedly flagged as incomplete, unverifiable, and skewed towards large firms. The informal sector, where over 90 per cent of India's workforce earns its living, was essentially estimated by extrapolation from surveys that were already a decade old.
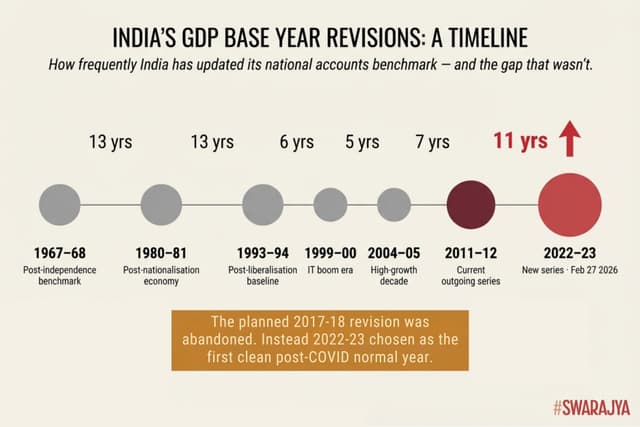
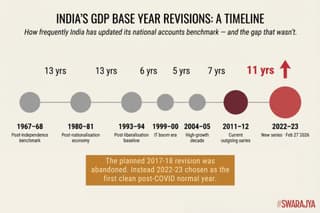
On February 27, 2026, that changes. The new GDP series — with a base year of 2022-23 — is not just a routine statistical housekeeping exercise. It is, in important respects, the first attempt to measure the economy India has actually become, rather than the economy India was when Manmohan Singh and Sonia Gandhi were presiding over the UPA's second term.
The Problem with 2011-12
To understand why the old series was straining at the seams, it helps to think about what has happened to the Indian economy since 2011-12.
GST did not exist. The digital payments infrastructure — UPI, BHIM, Aadhaar-linked accounts — if it existed at all, did so only in the pages of a file in North Block. E-commerce was a fraction of its current scale. The gig economy was not a category economists took seriously. The Production-Linked Incentive schemes that have reshaped manufacturing were not yet conceived. And the informal sector — MSMEs, street vendors, small workshops — was being estimated using data from surveys conducted in an era when many of these businesses operated entirely off any formal grid.
The price deflators used to strip inflation out of nominal growth figures and arrive at "real" GDP were drawn from a basket of roughly 180 items. That basket was calibrated to 2011-12 consumption patterns and production structures.
As India's economy shifted — towards services, digital transactions, urban consumption, and complex manufacturing supply chains — the basket became increasingly unrepresentative.
The result was what economists describe as noise in the signal: growth estimates that were harder to trust, easier to question, and increasingly out of step with what surveys of actual household consumption were showing on the ground.
The Indian Economy in 4K HD
The 2022-23 series addresses this through several layers of reform, each targeting a specific weakness in the old methodology.
The most significant is the shift to double deflation.
Under the old single-deflation approach, MoSPI used a single price index to convert nominal output into real output. It doesn't look separately at whether the prices of inputs went up or down differently from the prices of finished products or the output.
Under double deflation, both output and intermediate consumption are separately deflated using relevant price indices to calculate value added at constant prices.
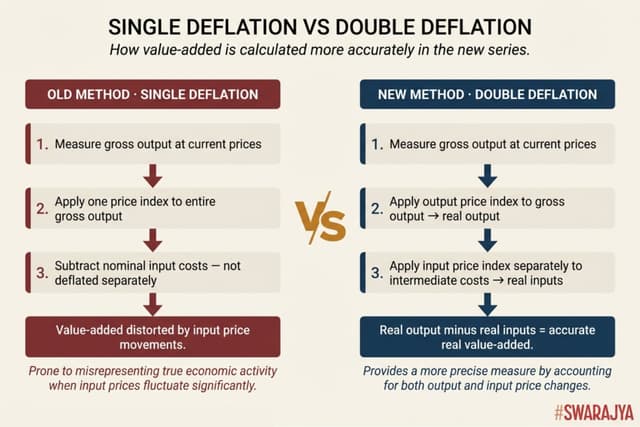

This matters most in sectors with complex supply chains — manufacturing, agro-processing, chemicals — where input prices and output prices can move in very different directions. MoSPI Secretary Saurabh Garg confirmed that single deflation has been completely done away with, and that deflators will now be applied at a more granular level.
The deflator basket itself has been radically expanded. From roughly 180 items, the new series uses 500–600 items drawn from both the Consumer Price Index and the Wholesale Price Index.
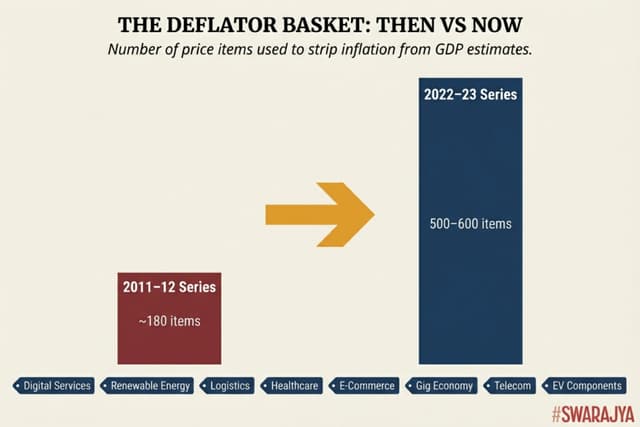

This is not merely a quantitative improvement. It means that price movements in sectors India barely tracked before — digital services, renewable energy components, logistics, healthcare — will now be reflected in how real growth is calculated.
The distortions that came from applying broad, outdated price indices to a structurally transformed economy will be substantially reduced.
GST: From Compliance Tool to Economic Mirror
Perhaps the most consequential single change in the new series is the systematic integration of GST data into GDP estimation.
According to a senior MoSPI official quoted in 2024, GSTN had until recently been reluctant to share transaction-level data with the statistics ministry, citing confidentiality concerns. That appears to be changing.
MoSPI's sub-committee on new data sources — whose report was released on February 24, 2026 — was chaired by Manish Sinha, the CEO of GSTN himself, a strong signal of institutional cooperation.
MoSPI has stated that GST data will be anonymised before use and incorporated as a core input into the new series. This matters enormously. GST filings cover a vast swath of the formal economy — every registered business above the threshold is generating a monthly data trail of output, inputs, and tax liability. This is real-time, granular, and verifiable in a way that MCA balance sheets are not. The balance sheets come with lags, are often incomplete, and exclude enormous numbers of smaller companies that do not file audited accounts.
According to MoSPI Secretary Saurabh Garg, GSTN datasets will also help states estimate Gross State Domestic Product more accurately — a significant secondary benefit. State-level economic data in India has long been of uneven quality, making inter-state comparisons and fiscal transfers harder to calibrate.
Alongside GST, the new series integrates data from the Public Financial Management System (PFMS), which tracks government expenditure in near real time, and e-Vahan, the national vehicle registration database. The latter is a small but telling detail: e-Vahan allows statisticians to track the actual volume of vehicles produced and registered, providing a physical-volume indicator for the automotive sector that does not depend on company self-reporting.
The Informal Sector: A Partial but Real Step Forward
The most difficult measurement problem in Indian GDP estimation has always been the informal sector. This is the vast, unincorporated economy of small traders, household enterprises, kirana stores, construction workers, and agricultural labourers that accounts for an enormous share of actual economic activity but counts for little in formal estimates.

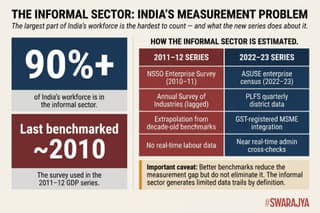
The new series makes progress here too. The recently completed Annual Survey on Unincorporated Sector Enterprises (ASUSE) will be incorporated into GDP calculations, providing a more current benchmark for the informal sector than the decade-old surveys it replaces. The Periodic Labour Force Survey (PLFS), which now produces quarterly district-level employment data, will also feed into the new series, giving statisticians a more granular picture of where labour is deployed and in what sectors.
The Supply Use Table: Closing the Internal Contradiction
One of the more technically significant changes in the new series is the integration of a Supply Use Table framework with the national accounts. India has long produced GDP estimates using both the production approach (what industries produce) and the expenditure approach (what households, firms, and government spend).
In a well-constructed statistical system, these two should converge. In the old series, they frequently did not — producing a "discrepancy" line in the national accounts that indicated the two approaches were measuring different things.
The Supply Use Table maps what industries produce against how those goods and services are used — by other industries or final consumers — and its integration is expected to minimise the discrepancy between the production and expenditure approaches to GDP measurement.
What the Revision Actually Means
There is a temptation, in reporting on a GDP revision, to focus on whether the headline growth number goes up or down. MoSPI officials have consistently said they do not expect large deviations from previous estimates. The value of the new series is not primarily in producing a different number of GDP growth for FY2025-26. It is in producing numbers that are more reliably generated, more internally consistent, more aligned with international standards.
India's economy has changed profoundly since 2011-12. The statistical infrastructure used to measure it had not kept pace. What the GDP series revision represents is the state finally building the instruments to see its own economy clearly.